Create Data Alerts in Bold BI
Data Alert provides users with the ability to track specific conditions and send alerts to specified recipients via email when a predefined threshold is met.
Add a Data Alert
Follow these steps to create the new data alert with the desired dashboard.
Steps to create a schedule
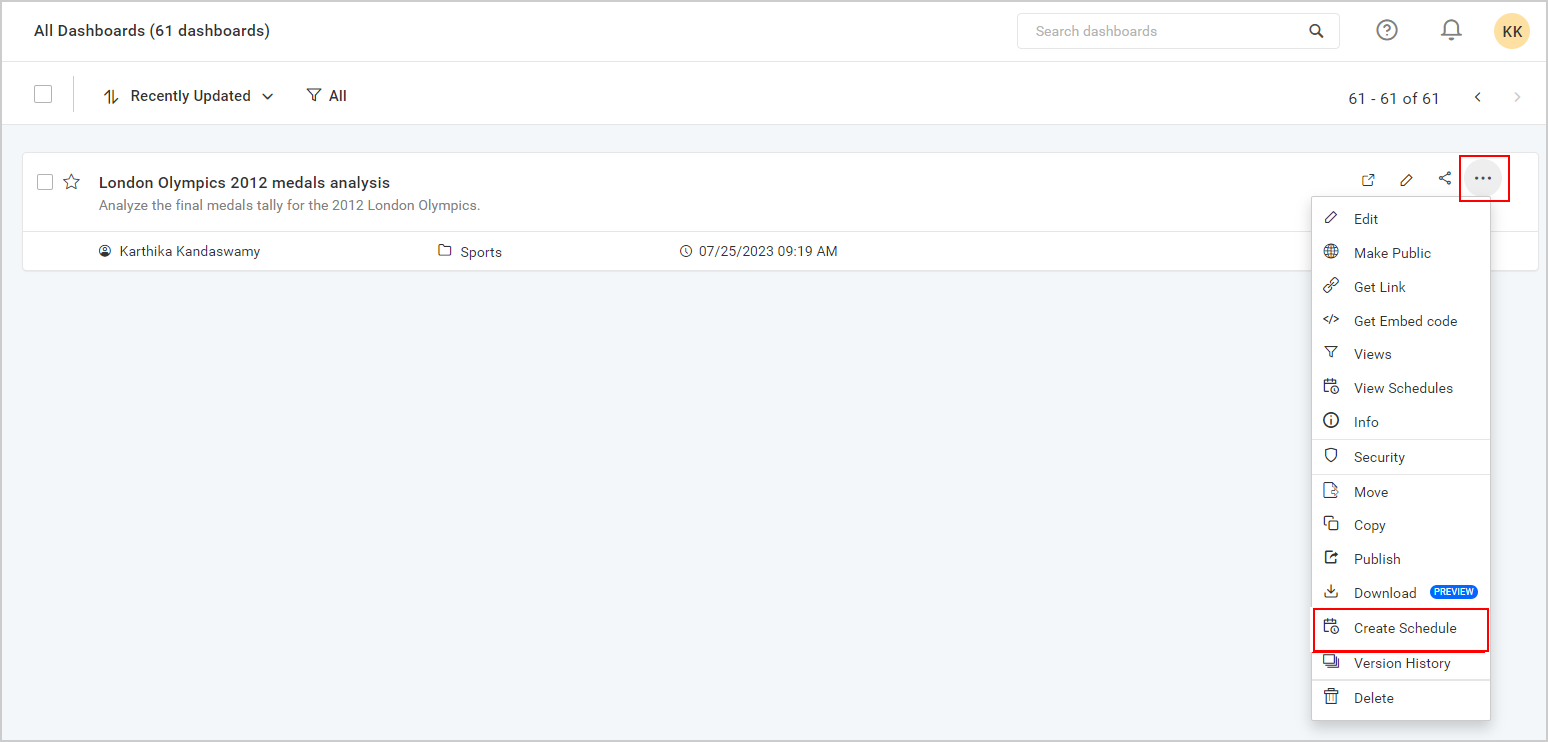
Select dashboard
Click Actions in the dashboard grid context menu and select Create Schedule to schedule the corresponding dashboard.
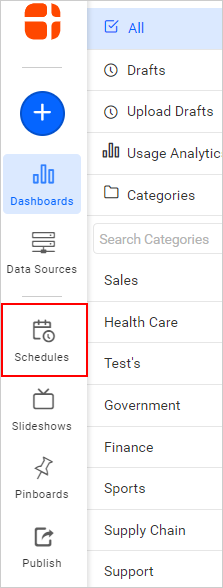
Otherwise, click on the Schedule option in the side menu to create a schedule.
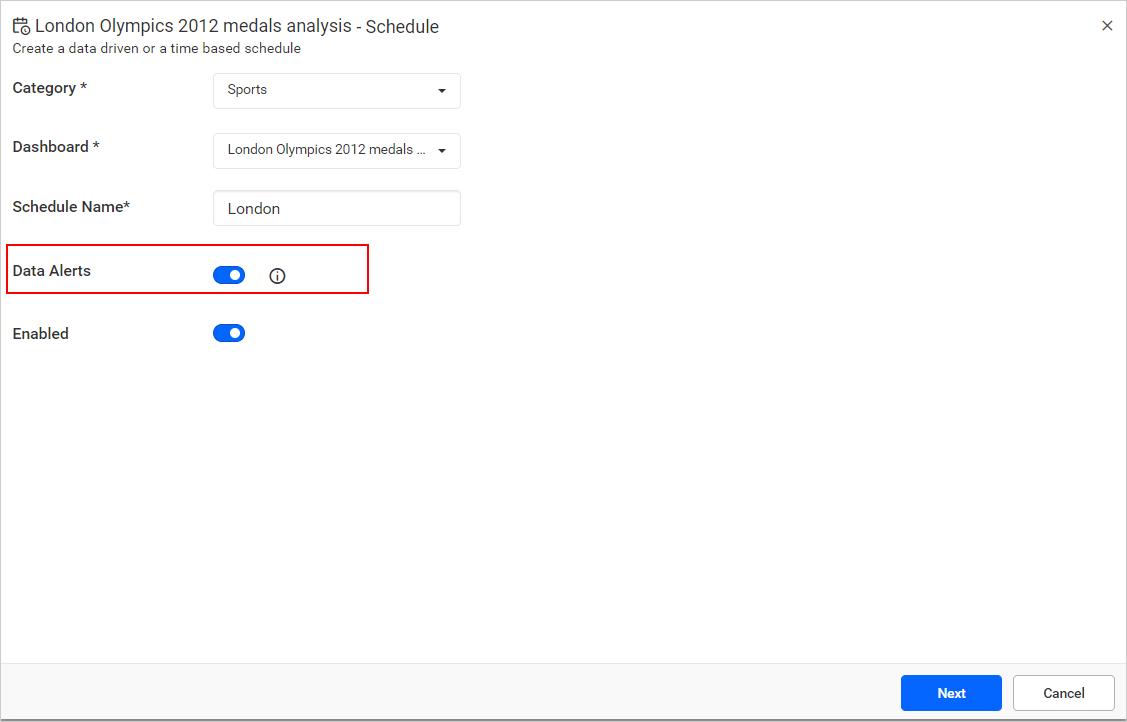
Schedules can be created for each respective dashboard. Enter the schedule Name, and then enable Data Alerts.
Data Alert
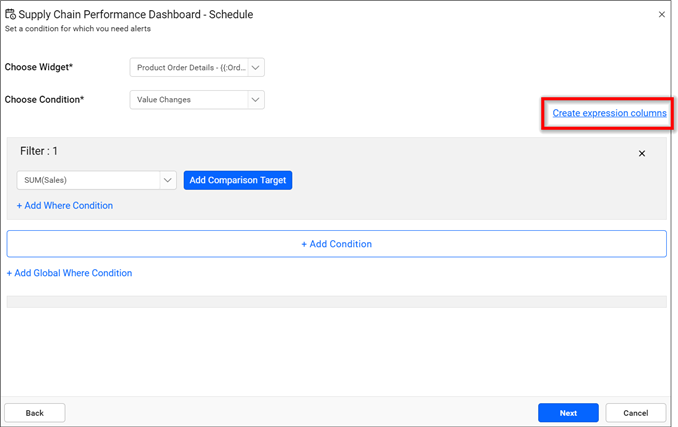
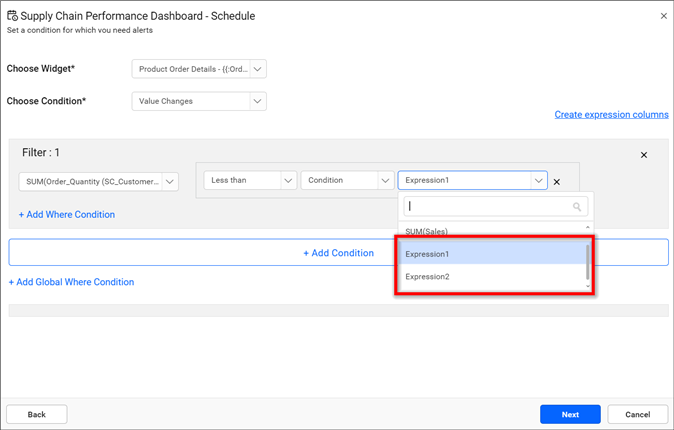
The Data Alert screen allows you to add conditions for the desired dashboards. Each condition includes the source column name, aggregation, and target column for comparison. A Where Condition can be added globally or for each individual condition. After successful validation, the user can navigate to the next screen. If there is an error, a message will be displayed at the top of the dialog box, and the screen will remain until successful validation.
-
Select the
Widgetto which you want to add the threshold condition and choose one of theConditions. By default, the condition will beValue Changes.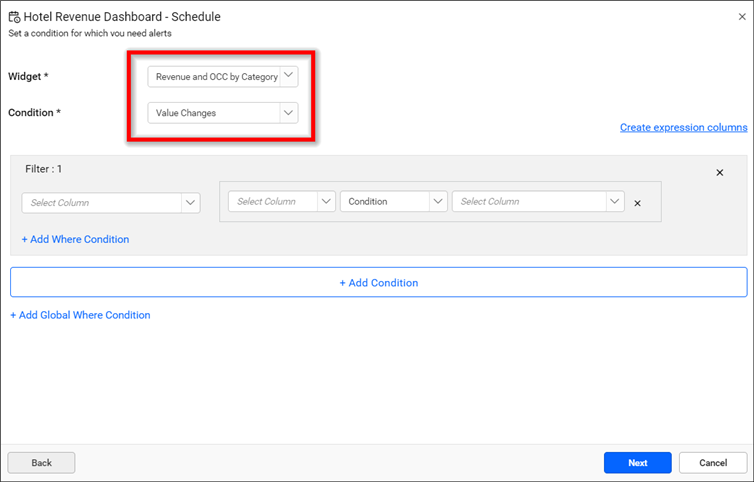
Value Changes- Checks whether the filtered value changes and can be evaluated as either an expression or a single column.
If it is an expression, the user can be notified when it satisfies the condition.
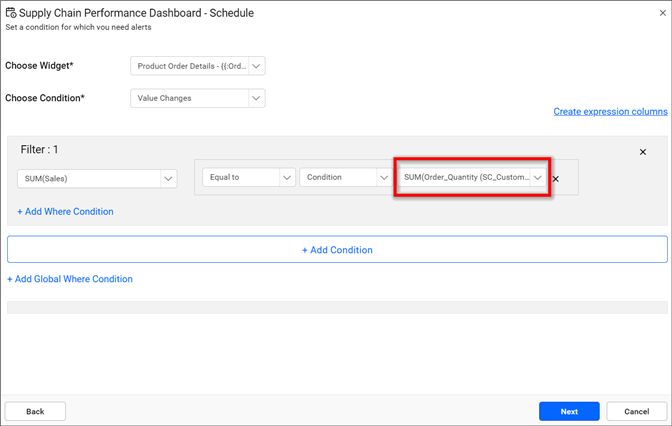
-
The user can add the expression as needed by following these steps:
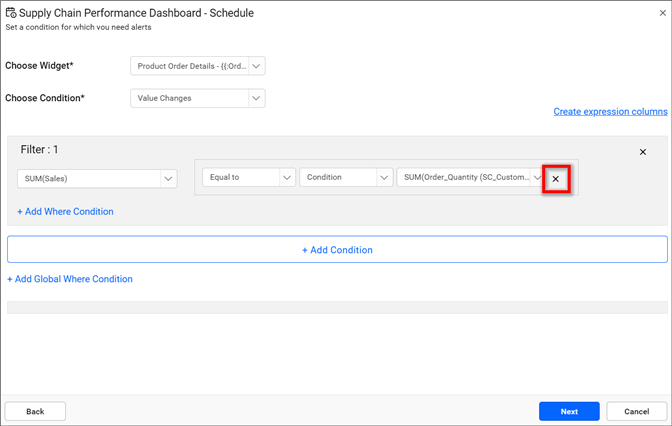
-
To switch the expression to a single column, click on the close button.
-
Click
Add Comparison Targetto add expression.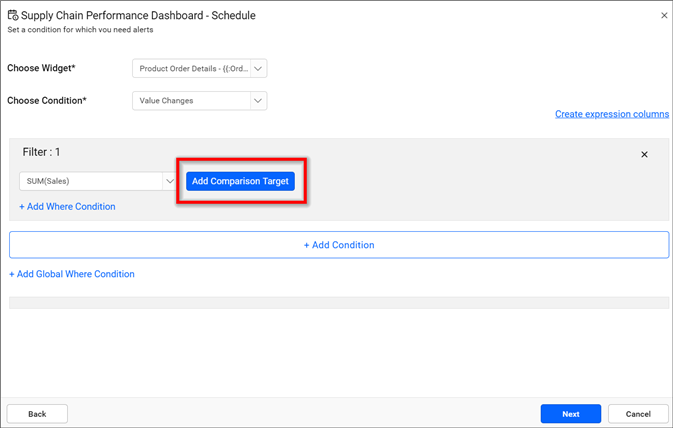
If it is a single column, the user can be notified when there is a change in the column value compared to the previous value.
2.Increases - Checks whether the filtered value increases once.
3.Continuously Increases - Checks whether the filtered value increases continuously.
4.Decreases - Checks whether the filtered value decreases once.
5.Continuously Decreases - Checks whether the filtered value decreases continuously.
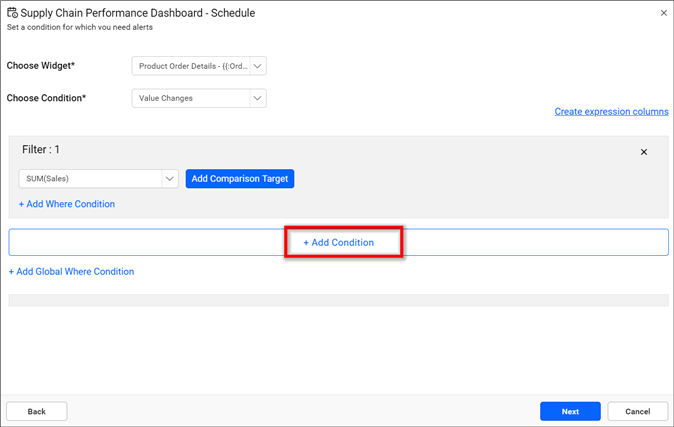
- To add more conditions, click on
Add Condition.
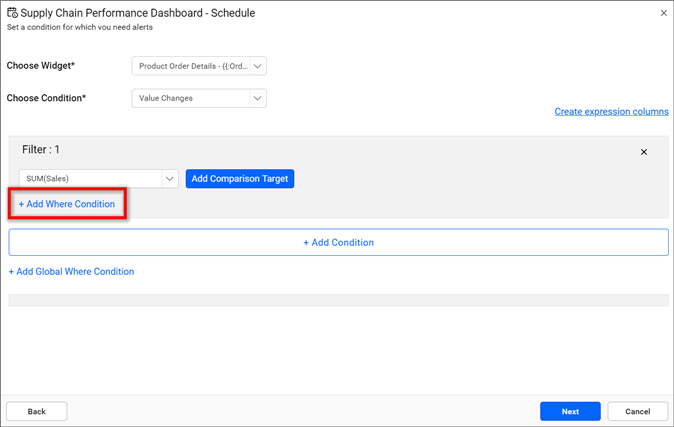
- Add a
Wherecondition for each filter by clicking theAdd Where Conditionbutton.
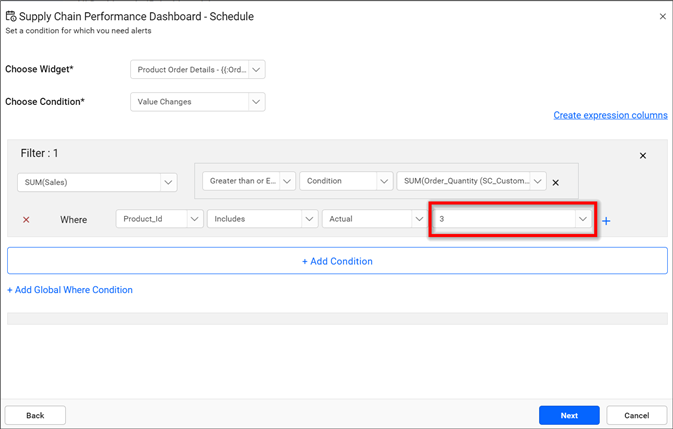
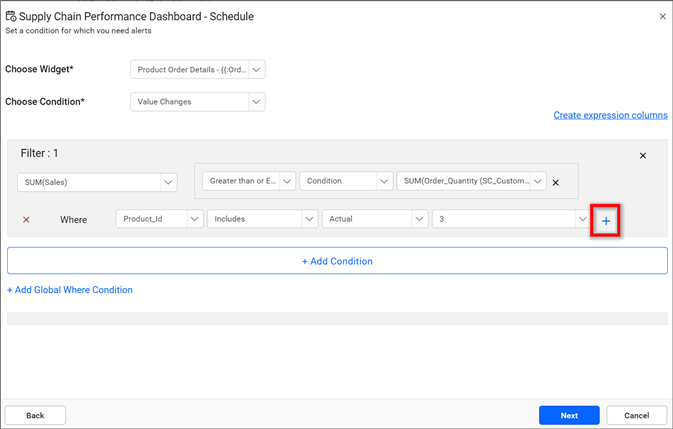
- The column values can be compared with either custom or actual values. Actual values are listed from the database, while custom values are provided by the user.
Create a New Expression
In the data alert, there is now an option to create expressions with combinations of unbounded data source columns of the selected widget and multiple functions, such as [Sum(Column1) - Sum(Column2)].
Steps to add a custom expression
- After selecting the widget, click on the
Create Expression Columnslabel at the top of the filter in the data alerts screen.
- The create expression dialog box will open as follows:
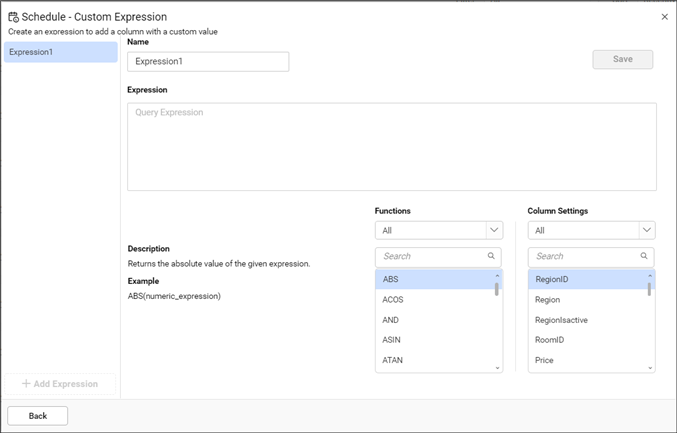
In the dialog box, the create expressions column lists all the saved expressions of the appropriate data source.
You can add a new expression by providing values for the name and expression input fields.
The functions and column settings drop-downs provide multiple functions and data source columns of the selected widget to create expressions.
- Click
Addto add a default expression name in the name input field.
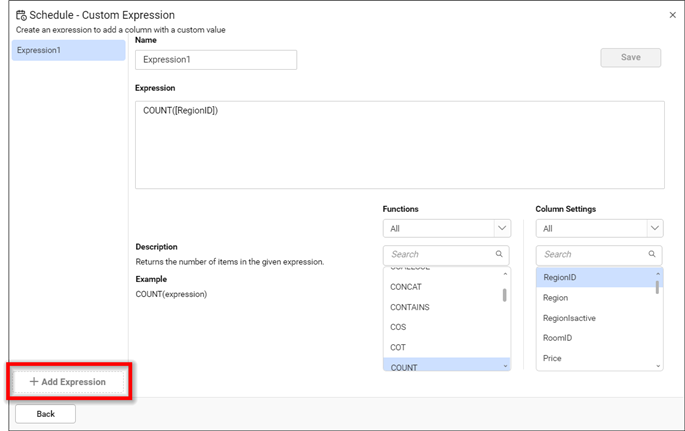
Expression name can also be changed.
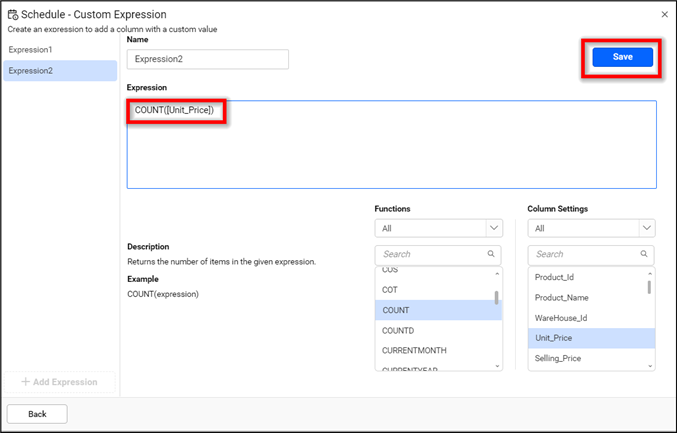
- Expressions can be formed by combining functions and column names from the drop-down menus for functions and column settings.
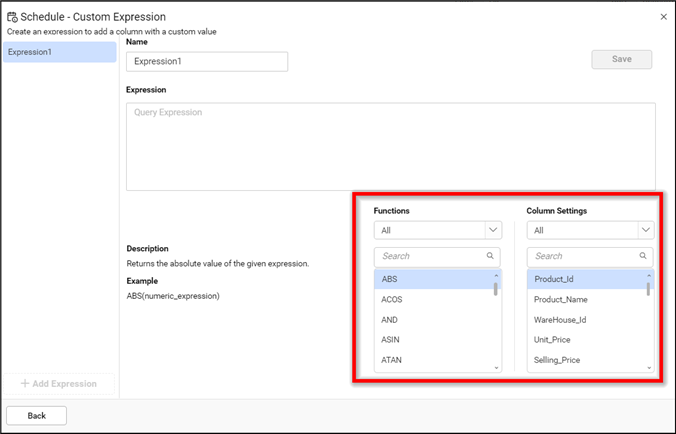
Functions and column settings are categorized into various types and can also be filtered using the drop-down menus below their headings.
When clicking on a function, an example and short description are displayed on the left.
Expressions can be inserted into their input field by double-clicking the required values from the functions and column settings drop-downs.
- The created expression can be saved by clicking on
Save.
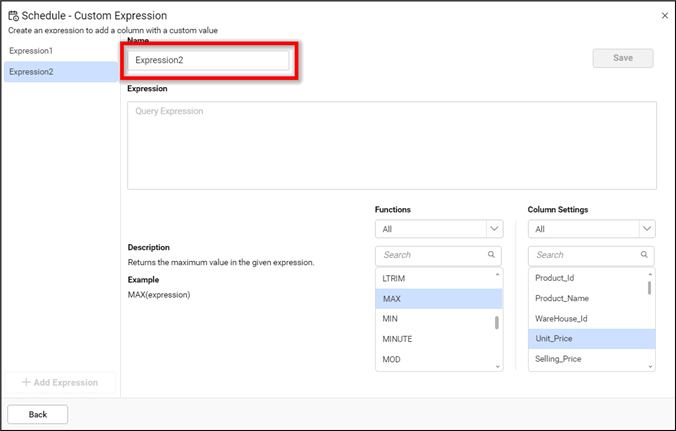
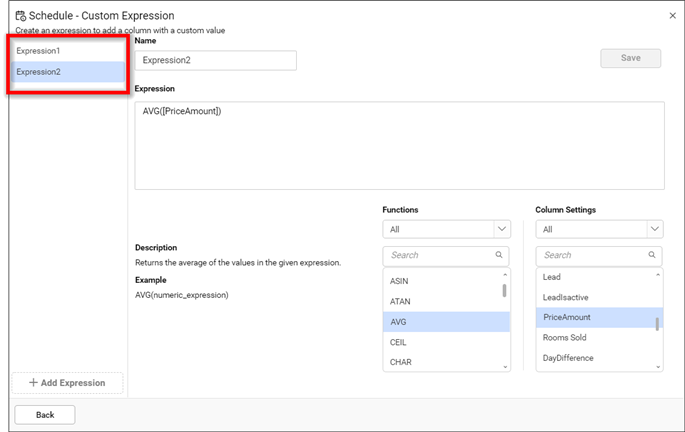
- The saved expression will be listed under the custom expressions column.
-
Clicking on an expression in the list will display the name and expression in the right panel. You can update the saved expression and save it again.
-
Expressions can be deleted by clicking on the close icon that appears when hovering over the custom expressions list.
![]()
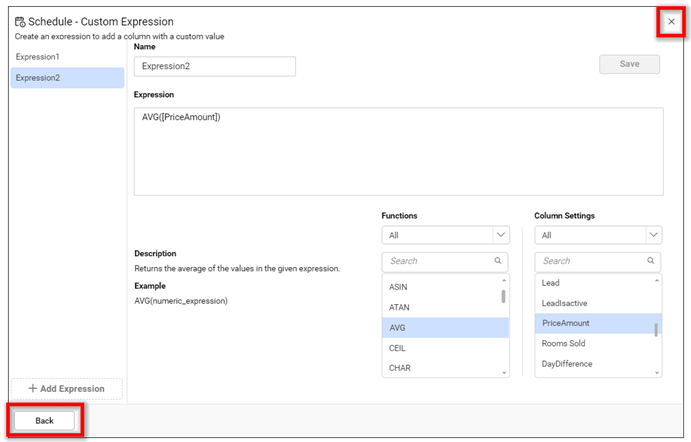
- Click on the close icon or the
Backbutton to exit the custom expression dialog box.
- Once the dialog box is closed, all saved expressions will be listed under the drop-down menus for both measures and dimensions in the data alerts screen.
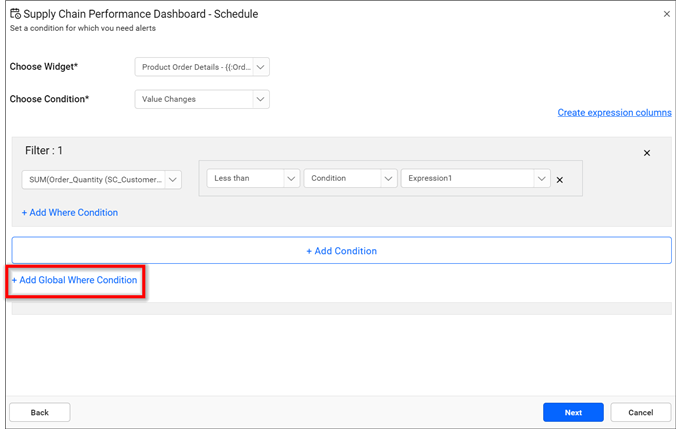
Global Where Condition
Add a common Where condition for two or more filters by clicking the Add Global Where Condition.
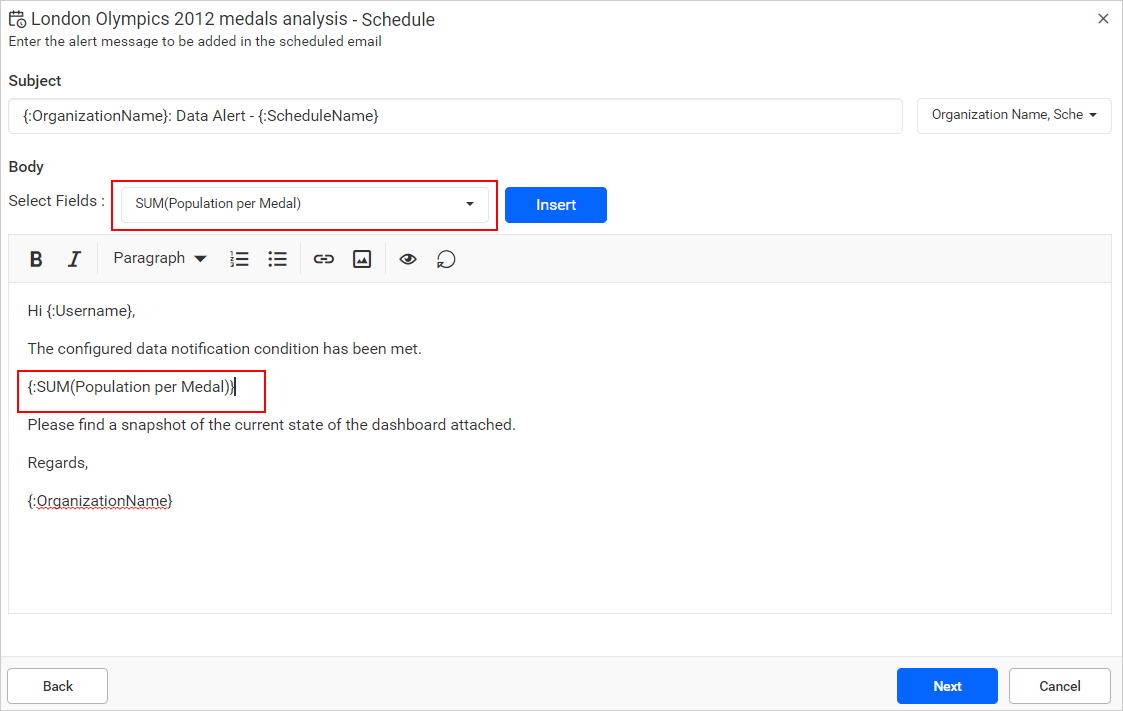
Email Editor
The email editor provides an option to edit the email body of the data alert mail and embed the selected database column values into the email body. The Select Field describes the database columns that are chosen on the data alert screen. The values of each inserted column can be replaced while sending mail by Bold BI.
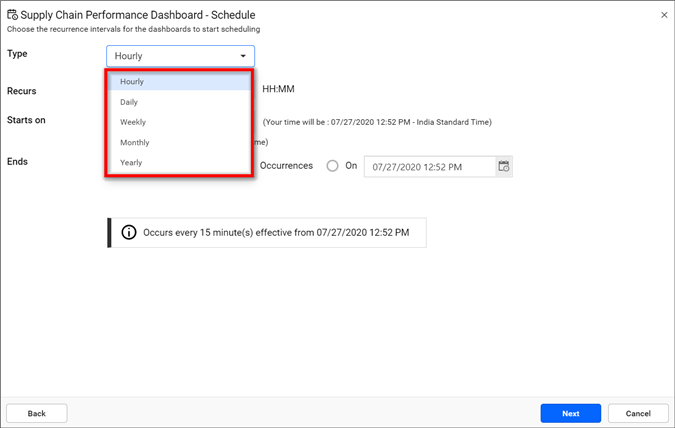
Recurrence Interval
Dashboards can be scheduled on an hourly, daily, weekly, monthly, and yearly basis.
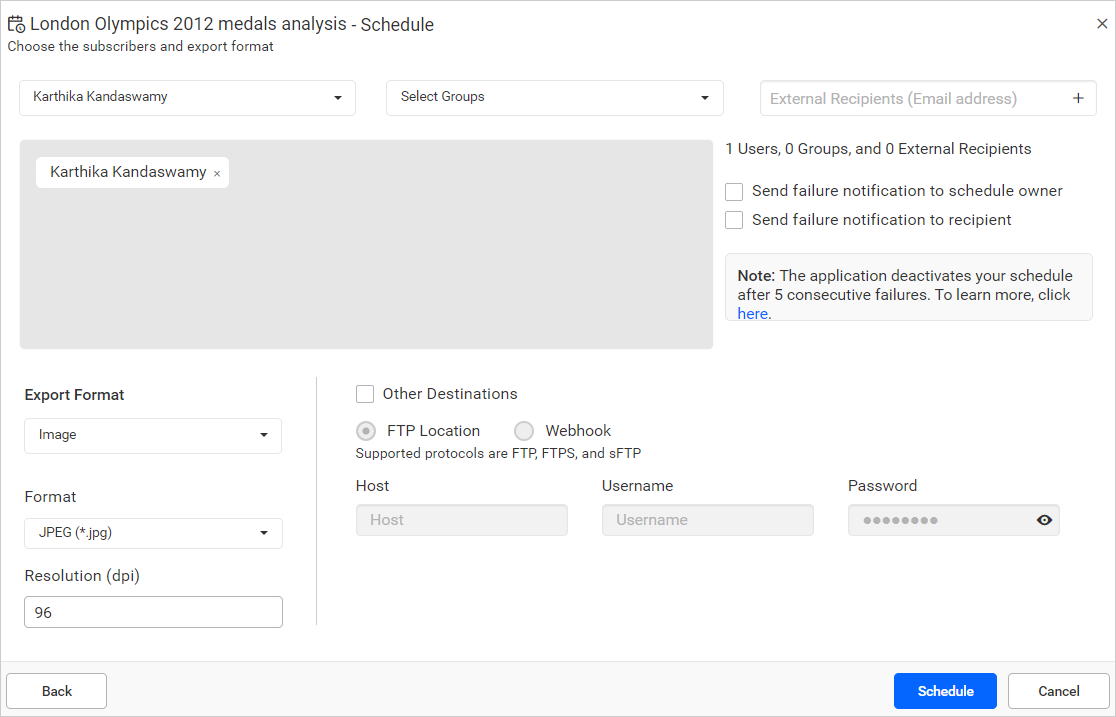
Choose Subscribers
Dashboards can be exported as an Image, PDF, CSV, and Excel. Exported dashboards can be sent to individual users, groups, or external recipients.
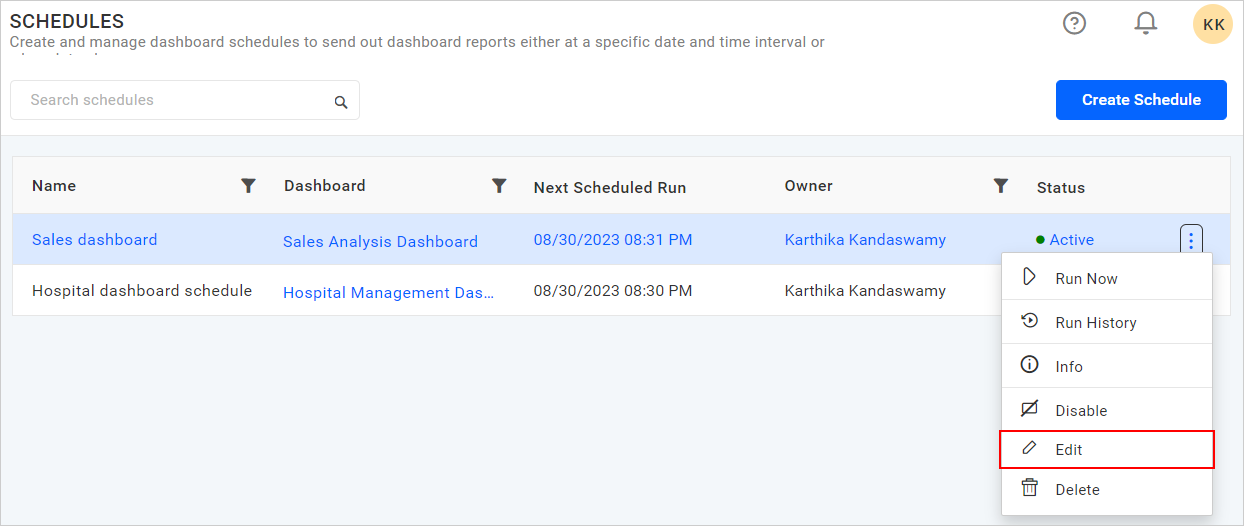
Edit Data Alert
The name, data alert, schedule type, email content, export format, and the recipients can be changed in the Edit schedule dialog box.
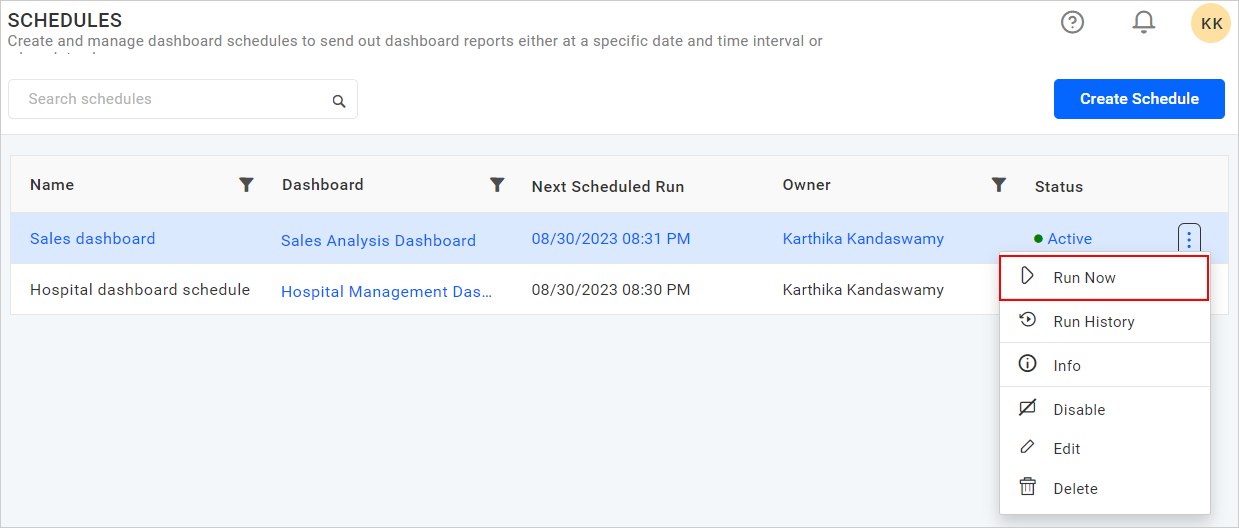
Run Now
Schedules can be made to run on demand by clicking the Run Now option in the schedule grid context menu. The dashboard gets exported in the specified format and sent to the recipients if the threshold condition is met.
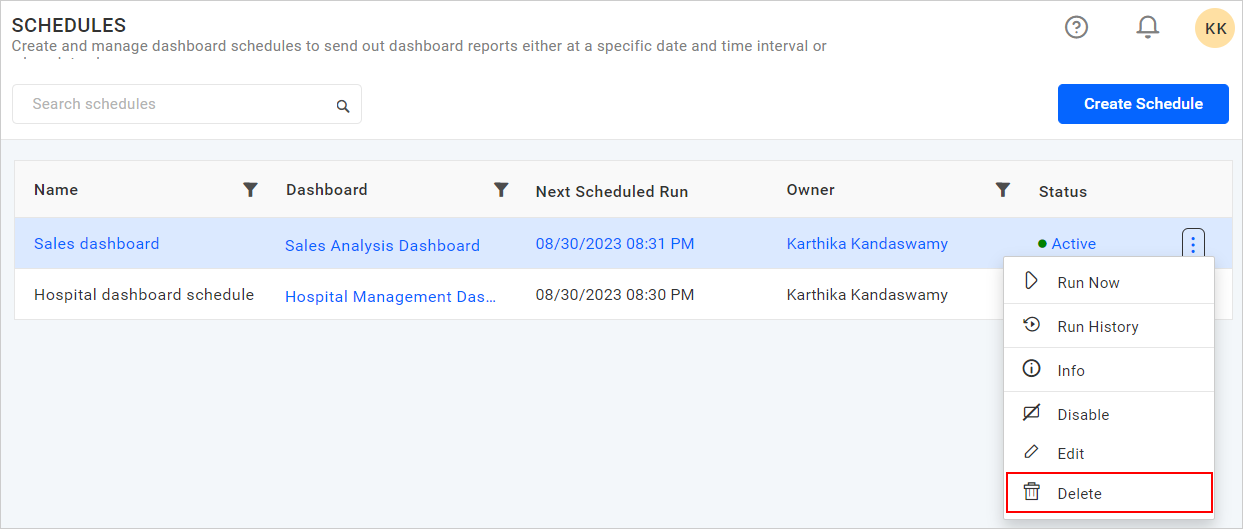
Delete Data Alert
Data alert can be deleted from the dashboard server when it is no longer required. Click Actions in the schedules grid context menu and select Delete to delete the data alert.