Members
dashboardId
string
Defines the ID of the dashboard to be embedded from your Bold BI application.
- Required: Yes
- Default:
""(empty)
Example
var dashboard = BoldBI.create({
     dashboardId: "5cb065f7-dabb-4b0c-9b45-c60a5730e963"
});
dashboard.loadDashboard();
dashboardPath
string
Stores the dashboard path in the format of category name followed by dashboard name.
- Syntax:
/{category-name}/{dashboard-name} - Default:
""(empty)
Example
var dashboard = BoldBI.create({
     dashboardPath: "/Samples/Sample Dashboard"
});
dashboard.loadDashboard();
embedContainerId
string
The ID of a div element in which the dashboard will be initialized and rendered.
- Required: Yes
- Default:
""(empty)
Example
<div id="container"></div>
<script>
     var dashboard = BoldBI.create({
          embedContainerId: "container",
     });
     dashboard.loadDashboard();
</script>
embedType
object
There are two types of embedding available: component and iframe. In the component type, you will use the embedding SDK to render the dashboard. In the iframe type, you will load the dashboard URL in the iframe and the dashboard will be rendered.
- Possible Values:
BoldBI.EmbedType.ComponentBoldBI.EmbedType.IFrame
- Default:
BoldBI.EmbedType.Component
Example
var dashboard = BoldBI.create({
     embedType: BoldBI.EmbedType.Component,
});
dashboard.loadDashboard();
embedToken
string
Stores the Embed Authorization API access token to reduce redundant API calls and improve performance.
- Required: No
- Default:
""(empty) - Note: Supported from v12.1. Use the corresponding SDK and build version. Additionally we have created sample to explain how this api works
Example
var dashboard = BoldBI.create({
    embedToken: "eyJhbGciOiJIUzI1NiIsInR5cCI6IkpXVCJ9.eyJlbWFpbCI6ImRldm9wc0Bib2xkYmkuY29tIiwidXBuIjouYm9sZGJpZGVtby5jb20vYmkvc2l0ZS9zaXRlMSIsImF1ZCI6Imh0dHBzOi8vaG90Zml4LXdpbmRvd3MuYm9sZGJpZGVtby5jb20vYmkvc2l0ZS9zaXRlMSJ9.JzbqVr6Brv1mAEvnbHnE-FuShos"
});
dashboard.loadDashboard();
environment
object
Specifies the type of Bold BI application, either Cloud or Enterprise edition.
- Possible Values:
BoldBI.Environment.CloudBoldBI.Environment.Enterprise
- Default:
BoldBI.Environment.Enterprise
Example
var dashboard = BoldBI.create({
    environment: BoldBI.Environment.Enterprise
});
dashboard.loadDashboard();
expirationTime
number
Specifies the access token expiration time of the dashboard in seconds.
- Required: No
- Default:
86400(24 hours)
Example
var dashboard = BoldBI.create({
    expirationTime: 100000
});
dashboard.loadDashboard();
filterParameters
string
Supports filtering of the dashboard using URL or dashboard parameters.
- Supported Cases:
- URL Parameter:
{column_name}={value1},{value2},{value3} - Dashboard Parameter:
{parameter_name}={parameter_value}orIN({value1},{value2}) - Multiple URL Parameters:
{column_name1}={value1}&{column_name2}={value2} - Multiple Dashboard Parameters:
{parameter_name}={parameter_value}&&{parameter_name1}={parameter_value1} - Combination:
{column_name}={value1},{value2}&&{parameter_name}={parameter_value}or vice versa
- URL Parameter:
- Default:
""(empty)
Examples URL Parameter
var dashboard = BoldBI.create({
    filterParameters: "Continent=Asia,Africa,Europe"
});
dashboard.loadDashboard();
Dashboard Parameter (Literal)
var dashboard = BoldBI.create({
    filterParameters: "Department_DP=Sales"
});
dashboard.loadDashboard();
Dashboard Parameter (List)
var dashboard = BoldBI.create({
    filterParameters: "Department_DP=IN(Sales,Marketing)"
});
dashboard.loadDashboard();
Multiple URL Parameters
var dashboard = BoldBI.create({
    filterParameters: "Continent=Asia&Direction=East"
});
dashboard.loadDashboard();
Multiple Dashboard Parameters
var dashboard = BoldBI.create({
    filterParameters: "Department_DP=Sales&&Feedback=Good"
});
dashboard.loadDashboard();
Combination of URL and Dashboard Parameters
var dashboard = BoldBI.create({
    filterParameters: "Continent=Asia,Africa,Europe&&Department_DP=Sales"
});
dashboard.loadDashboard();
height
string
Defines the height of the embedding module in percentages or pixels.
- Optional: Yes
- Default: Inherits from the parent container
Example
var dashboard = BoldBI.create({
    height: "800px"
});
dashboard.loadDashboard();
hideErrorMessage
boolean
Enables or disables the display of error messages inside the dashboard container.
- Default:
false - Use Case: Set to
trueto suppress embedded error UI and handle errors via a custom callback.
Example
var dashboard = BoldBI.create({
    hideErrorMessage: true,
    onError: function (args) {
        var dashboardContainer = document.getElementById("dashboard");
        dashboardContainer.innerHTML = "Authorization is failed. Please provide valid authorization url.";
    }
});
dashboard.loadDashboard();
isBingMapRequired
boolean
Specifies whether Bing Map-related files need to be downloaded.
- Default:
false - Note: Set to
trueif the dashboard contains a Bing Map widget.
Example
var dashboard = BoldBI.create({
     isBingMapRequired: false,
});
dashboard.loadDashboard();
mode
object
Defines the dashboard rendering mode.
- Possible Values:
BoldBI.Mode.ViewBoldBI.Mode.DesignBoldBI.Mode.ConnectionBoldBI.Mode.DataSource
- Default:
BoldBI.Mode.View
Example
var dashboard = BoldBI.create({
     mode: BoldBI.Mode.View,
});
dashboard.loadDashboard();
nonce
string
Bypasses or loads dependencies from the Bold BI server when Content Security Policy (CSP) is enabled.
- Required: No
- Default:
""(empty) - Note: The same unique value must be used in both the
noncemember and the meta tag.
Example
<meta http-equiv="Content-Security-Policy" content="script-src 'self' 'nonce-8beb50ac-fc1d-4106-ba6b-798835ac0c1b'">
var dashboard = BoldBI.create({
     nonce = "8beb50ac-fc1d-4106-ba6b-798835ac0c1b"
});
dashboard.loadDashboard();
restrictMobileView
boolean
Restricts the mobile view on desktop when the browser width reaches a specified threshold.
- Default:
false
Example
var dashboard = BoldBI.create({
     restrictMobileView: true,
});
dashboard.loadDashboard();
serverUrl
string
The URL of the Bold BI application.
- Required: Yes
- Default:
""(empty)
Example
var dashboard = BoldBI.create({
     serverUrl: "https://mydashboard.com/bi/site/site1",
});
dashboard.loadDashboard();
token
string
Authenticates the dashboard without implementing the AuthorizeAPI endpoint.
- Required: No
- Default:
""(empty) - Note: Refer to the token generation documentation for details.
Example
var dashboard = BoldBI.create({
     token: "NjQ2ZDgwZjgtN2Q3MS00ZDQwLWFkNTItYTdkNDRhOGE2NmVi", // Use the generated API key
});
dashboard.loadDashboard();
To learn about the available limited supporting methods in embedding.
width
string
Defines the width of the embedding module in percentages or pixels.
- Optional: Yes
- Default: Inherits from the parent container
Example
var dashboard = BoldBI.create({
     width:"1200px", //The dashboard is now rendered with a width of 1200px.
});
dashboard.loadDashboard();
authorizationServer
headers
object
Transmits custom data or header values to the embedding application’s Authorization Server. As a result, you may find this value in the headers of the Authorization Server API.
- Optional: Yes
- Default:
{}(empty object) - Note: Please refer to the Knowledge Base article to know more.
Example
var dashboard = BoldBI.create({
     authorizationServer:{
          headers: {
               "Authorization": "Bearer eDIHDIJAdjakdnajdbaidhoasjasajnsJNININfsbfskdnskdnskdn"
          }
     }
});
dashboard.loadDashboard();
url
string
Any application that embeds a Bold BI dashboard and widget needs to authenticate with the Bold BI server. This authentication flow requires sending confidential information such as user email, group details, and embed signature to the Bold BI server. Therefore, you must implement this authentication flow in your server application and provide the URL for connecting to your server in the Bold BI embed instance.
- Required: Yes
- Default:
""(empty) - Note: Refer to the authorization server documentation for details.
Example
var dashboard = BoldBI.create({
     authorizationServer: {
          url:"https://serversample.com/embed-details/get",
     }
});
dashboard.loadDashboard();
autoRefreshSettings
The auto refresh feature allows you to configure the scheduled refreshing process of the dashboard. It is used to refresh the data based on the specified time.
enabled
boolean
Enables or disables the auto-refresh feature for the dashboard.
- Default:
false
Example
var dashboard = BoldBI.create({
     autoRefreshSettings:{
          enabled: false,
     }
});
dashboard.loadDashboard();
autoRefreshSettings.hourlySchedule
hours
number
Specifies the hourly time interval for auto-refreshing data.
- Default:
0
Example
var dashboard = BoldBI.create({
     autoRefreshSettings:{
          enabled: true,
          hourlySchedule: {
               hours: 1,
          }
     }
});
dashboard.loadDashboard();
minutes
number
Specifies the minute-by-minute time interval for auto-refreshing data.
- Default:
0
Example
var dashboard = BoldBI.create({
     autoRefreshSettings:{
          enabled: true,
          hourlySchedule: {
               minutes: 10,
          }
     }
});
dashboard.loadDashboard();
seconds
number
Specifies the second-by-second time interval for auto-refreshing data.
- Default:
0
Example
var dashboard = BoldBI.create({
     autoRefreshSettings:{
          enabled: true,
          hourlySchedule: {
               seconds: 30
          }
     }
});
dashboard.loadDashboard();
dashboardSettings
dashboardName
Specifies whether or not to update the Dashboards name in the header section for a Single Tab Dashboard. For Multi Tab Dashboard, it specifies the unique ID of the dashboard and the name in which it should be rendered.
- Default:
- Single Tab Dashboard:
""(empty) - Multi Tab Dashboard:
[](empty array)
- Single Tab Dashboard:
- Note: For Multi Tab Dashboard, use an array of objects with
dashboardIdanddashboardNamepairs.
Example (Single Tab Dashboard)
var dashboard = BoldBI.create({
    dashboardSettings: {
        dashboardName: "name",
    }
});
dashboard.loadDashboard();
Example (Multi Tab Dashboard)
var dashboard = BoldBI.create({
    dashboardSettings: {
        dashboardName: [
            { dashboardId: "fb63ae99-83b6-4752-97b7-890182a3729f", dashboardName: "value 1" },
            { dashboardId: "77fd95ce-ec8b-4f68-817c-f41cabfabd3a", dashboardName: "value 2" }
        ]
    }
});
dashboard.loadDashboard();
enableFilterOverview
boolean
Specifies whether to show or hide the Filter Overview icon in the dashboard banner.
- Default:
true
Example
var dashboard = BoldBI.create({
     dashboardSettings: {
          enableFilterOverview: true,
     }
});
dashboard.loadDashboard();
enableFullScreen
boolean
Specifies whether to show or hide the Full Screen icon in dashboard banner.
- Default:
false
Example
var dashboard = BoldBI.create({
     dashboardSettings: {
          enableFullScreen: true,
     }
});
dashboard.loadDashboard();
fontFamily
string
The fontFamily member allows you to customize the font of the Bold BI embedded modules such as the viewer, designer, data source, and pinboard embedding.
- Default:
""(empty) - Note: Before customizing the font, you need to upload the font file to the Bold BI Server. Refer to the Font documentation for details on uploading the font family file. Use the name provided during upload.
Example
var dashboard = BoldBI.create({
     dashboardSettings: {
          fontFamily : "Patrick-hand"
     }
});
dashboard.loadDashboard();
showDashboardParameter
boolean
Specifies whether to show or hide the Dashboard Parameter icon in dashboard banner.
- Default:
true
Example
var dashboard = BoldBI.create({
     dashboardSettings: {
          showDashboardParameter: true,
     }
});
dashboard.loadDashboard();
showExport
boolean
Specifies whether to show or hide the Export icon in dashboard banner.
- Default:
true
Example
var dashboard = BoldBI.create({
     dashboardSettings: {
          showExport: true,
     }
});
dashboard.loadDashboard();
showHeader
boolean
Specifies whether to show or hide the header panel in the Dashboard Viewer.
- Default:
true
Example
var dashboard = BoldBI.create({
     dashboardSettings: {
          showHeader: true,
     }
});
dashboard.loadDashboard();
showMetrics
boolean
Specifies whether to show or hide the Metrics option in the dashboard banner.
- Default:
true
Example
var dashboard = BoldBI.create({
     dashboardSettings: {
          showMetrics: true,
     }
});
dashboard.loadDashboard();
showMoreOption
boolean
Specifies whether to show or hide the Option icon in dashboard banner.
- Default:
true
Example
var dashboard = BoldBI.create({
     dashboardSettings: {
          showMoreOption: true,
     }
});
dashboard.loadDashboard();
showRefresh
boolean
Specifies whether to show or hide the Refresh icon in dashboard banner.
- Default:
true
Example
var dashboard = BoldBI.create({
     dashboardSettings: {
          showRefresh: true,
     }
});
dashboard.loadDashboard();
dashboardSettings.filterOverviewSettings
showSaveAsIcon
boolean
Specifies whether to display or hide the Save As option in the Filter Overview section of the dashboard banner.
- Default:
false
Example
var dashboard = BoldBI.create({
     mode: BoldBI.Mode.View,
     dashboardSettings: {
          filterOverviewSettings :{
            showSaveAsIcon: true,// To enable save as option in filter overview
          }
     }
});
dashboard.loadDashboard();
showSaveIcon
boolean
Specifies whether to display or hide the Save option in the filter overview section of the dashboard banner.
- Default:
false
Example
var dashboard = BoldBI.create({
     mode: BoldBI.Mode.View,
     dashboardSettings: {
          filterOverviewSettings :{
            showSaveIcon: true,// To enable save option in filter overview
          }
     }
});
dashboard.loadDashboard();
showViewSavedFilterIcon
boolean
Specifies whether to display or hide the View Saved Filter option in the Filter Overview section of the dashboard banner. When clicked, it triggers the onViewSavedFiltersClick event, allowing customization of the views dialog and additional actions.
- Default:
false
Example
var dashboard = BoldBI.create({
mode: BoldBI.Mode.View,
dashboardSettings: {
filterOverviewSettings :{
showViewSavedFilterIcon: true,// To enable view saved filters option in filter overview
},
onViewSavedFiltersClick: function(args) {
// Retrieves the array of view information from 'args.viewInfos' and perform further actions.
console.log(args.viewInfos); //The 'args.viewInfos' contains a list of views in the form of an array.
},
}
});
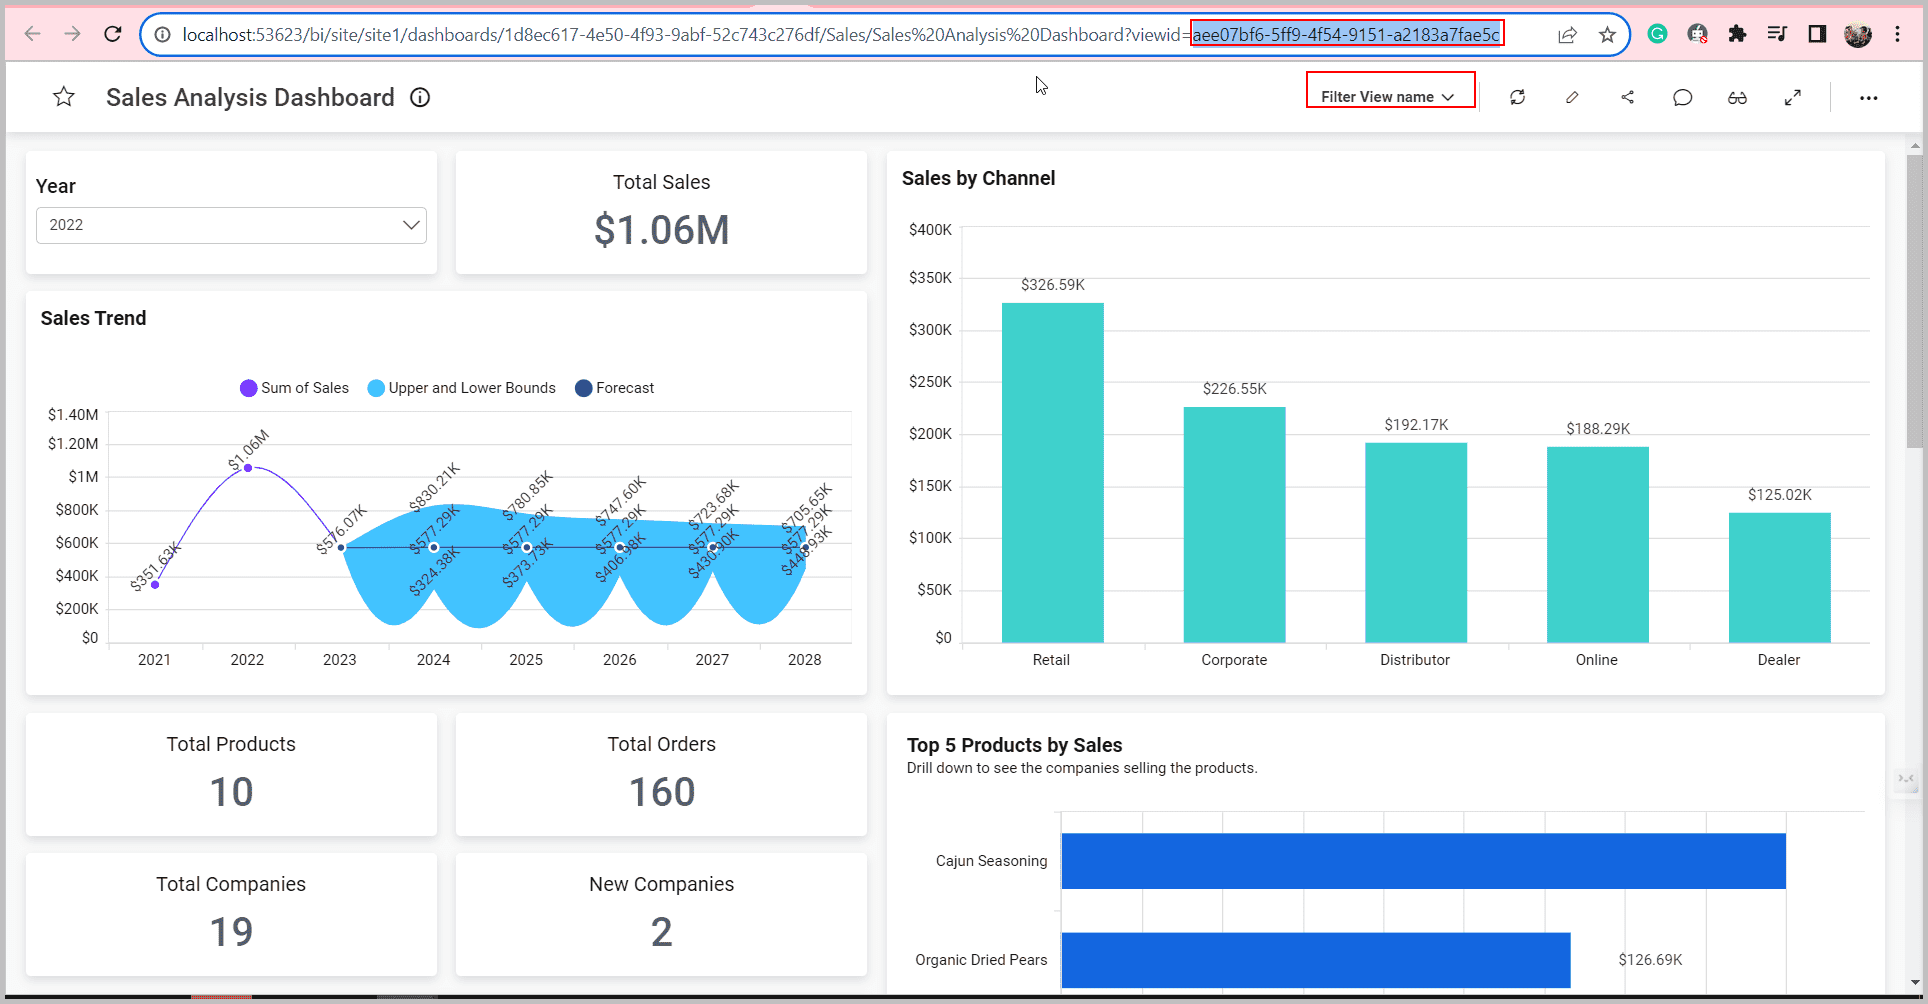
dashboard.loadDashboard();dashboardSettings.filterOverviewSettings.viewId
string
Allows embedding the dashboard with views by passing the viewId value, viewName, and query string in the filterParameters.
- Default:
""(empty) - Note: To obtain the view ID, extract it from the URL of the corresponding dashboard in its view. Refer to the Knowledge Base article for details on retrieving
viewNameand query string via the REST API. - Image Reference:
Example
var dashboard = BoldBI.create({
     mode: BoldBI.Mode.View,
     dashboardSettings: {
          filterOverviewSettings :{
            viewId: '0732e6c9-f7d6-469a-85e0-a7a4b22dbb2a' // View ID
            viewName: 'Filter View' // View name
          }
     },
     filterParameters: 'filterQuery=[{"ucn":"Column1","cn":"Orderdate","rn":"ComboBox2","ir":false,"ims":false,"fi":"92884626db4ffba31a49504a4864e4","ipw":false,"dimfi":{"c":"Include","t":["2022"]}}]', //query string of the respective view
});
dashboard.loadDashboard();
dashboardSettings.filterOverviewSettings.viewName
string
Allows embedding the dashboard with views by passing the viewName value and query string in the filterParameters.
- Default:
""(empty) - Note: Refer to the Knowledge Base article for details on retrieving
viewNameand query string via the REST API.
Example
var dashboard = BoldBI.create({
     mode: BoldBI.Mode.View,
     dashboardSettings: {
          filterOverviewSettings :{
            viewName: 'Filter View' // View name
          }
     },
     filterParameters: 'filterQuery=[{"ucn":"Column1","cn":"Orderdate","rn":"ComboBox2","ir":false,"ims":false,"fi":"92884626db4ffba31a49504a4864e4","ipw":false,"dimfi":{"c":"Include","t":["2022"]}}]', //query string of the respective view
});
dashboard.loadDashboard();
dashboardSettings.viewDataSettings
enableColumnSelection
boolean
Specifies whether to show or hide the “Select Column” button in the view underlying data of the widget.
- Default:
true
Example
var dashboard = BoldBI.create({
     dashboardSettings: {
          viewDataSettings :{
            enableColumnSelection: false,//Select column button will be hidden in the dashboard viewer.
          }
     }
});
dashboard.loadDashboard();
enableExporting
boolean
Specifies whether to show or hide the export option in the view underlying data of the widget.
- Default:
true
Example
var dashboard = BoldBI.create({
     dashboardSettings: {
          viewDataSettings :{
            enableExporting: false,//The Export option will be hidden in the dashboard viewer.
          }
     }
});
dashboard.loadDashboard();
showAllColumns
boolean
Specifies whether to show or hide the display of all columns in the table in the View Underlying Data of the widget.
- Default:
false
Example
var dashboard = BoldBI.create({
     dashboardSettings: {
          viewDataSettings : {
            showAllColumns: true,//Column options are all checked in the dashboard viewer.
          }
     }
});
dashboard.loadDashboard();
designCanvasSettings
margin
integer
Customize the margins of the dashboard using the corresponding integer values.
- Default:
null
Example
var dashboard = BoldBI.create({
     designCanvasSettings: {
          margin: 30,
     }
});
dashboard.loadDashboard();
dynamicConnection
The dashboard server provides a dynamic connection string feature for fetching the data used to render the dashboard.
identity
string
This property holds the values that will be passed to the API in the dynamic connection string feature. This allows the user to use this identity in their API for validation and providing the required connection string.
- Default:
""(empty)
Example
var dashboard = BoldBI.create({
     dynamicConnection: {
          isEnabled: true,
          identity: "",
     }
});
dashboard.loadDashboard();
isEnabled
boolean
Specifies whether to show or hide the dynamic connection string feature.
- Default:
false
Example
var dashboard = BoldBI.create({
     dynamicConnection: {
          isEnabled: false,
     }
});
dashboard.loadDashboard();
embedAiAssistant
enableAiAssistant
boolean
Enables the AI Assistant for generating and modifying widgets using natural language queries. The AI Assistant enhances widget creation and customization by leveraging advanced AI models, making data visualization more intuitive and accessible. This feature is available in both Cloud and Enterprise editions for Dashboard Viewer, Dashboard Designer, Single Widget, and Pinboard embeddings.
- Default:
false - Note: Ensure the SDK and Bold BI server versions match. Refer to here for more details.
- Version Info:
- Until 9.1.73: Use
enableAiAssistantdirectly in thecreatemethod. - From 10.1.18:
enableAiAssistantmust be set insideembedAiAssistant. - From 12.1 onwards: Use
enabledinstead ofenableAiAssistant.
- Until 9.1.73: Use
Example (Before 12.1)
var dashboard = BoldBI.create({
    embedAiAssistant: {
        enableAiAssistant: true
    }
});
dashboard.loadDashboard();
Note: Please use the SDK and Bold BI server from the same version. Starting from version 12.1, the AI Assistant settings are restructured. Use the
enabledobjects as shown below.
Example (From 12.1 onwards)
var dashboard = BoldBI.create({
    embedAiAssistant: {
        enabled: true,
        summary: {}
    }
});
dashboard.loadDashboard();
Note: A summary block is required to enable the AI Assistant due to a known issue in version 12.1.5.
name
boolean
Customizes the title of the AI Assistant as desired. Requires the enabled member API.
- Default:
false
Example
var dashboard = BoldBI.create({
     embedAiAssistant: {
          enabled: true,
          name: "Embedded AI",
          summary: {
          }
     }
});
dashboard.loadDashboard();Note: A summary block is required to customize the title due to a known issue in version 12.1.5.
enableAiSummary
boolean
Specifies whether to show or hide the dashboard and widget summary option. Requires the enabledmember API.
- Default:
false - Note: Supported only in versions prior to 12.1. From 12.1 onwards, use
embedAiAssistant.summary.enabled.
Example (Before Version 12.1)
var dashboard = BoldBI.create({
     embedAiAssistant: {
          enableAiAssistant: true,
          enableAiSummary: true
     }
});
dashboard.loadDashboard();
Note: Please use the SDK and Bold BI server from the same version. Starting from version 12.1, the AI Assistant settings are restructured. Use the
enabledandsummaryobjects as shown below.
var dashboard = BoldBI.create({
     embedAiAssistant: {
          enabled: true,
          summary: {
               enabled: true
          }
     }
});
dashboard.loadDashboard();
enableDashboardSummary
boolean
Specifies whether to show or hide the AI Dashboard Summary option in the dashboard banner. Requires both enableaiassistant and enableAiSummary member APIs.
- Default:
false - Note: Supported only in versions prior to 12.1. From 12.1 onwards, use
embedAiAssistant.summary.includeDashboardSummary.
Default value
Example (Before 12.1)
var dashboard = BoldBI.create({
     embedAiAssistant: {
          enableAiAssistant: true,
          enableAiSummary: true,
          enableDashboardSummary: true
     }
});
dashboard.loadDashboard();
Note: Please use the SDK and Bold BI server from the same version. Starting from version 12.1, the AI Assistant settings are restructured. Use the
includeDashboardSummaryandsummaryobjects as shown below.
Example (From 12.1 onwards)
var dashboard = BoldBI.create({
     embedAiAssistant: {
          enabled: true,
          summary: {
               enabled: true,
               includeDashboardSummary: true
          }
     }
});
dashboard.loadDashboard();
enableWidgetSummary
boolean
Specifies whether to show or hide the AI Widget Summary option in the widgets. Requires both enableaiassistant and enableAiSummary to be set.
- Default:
false - Note: Supported only in versions prior to 12.1. From 12.1 onwards, use
embedAiAssistant.summary.includeWidgetSummary.
Example (Before 12.1)
var dashboard = BoldBI.create({
    embedAiAssistant: {
        enableAiAssistant: true,
        enableAiSummary: true,
        enableWidgetSummary: true
    }
});
dashboard.loadDashboard();
Note: Please use the SDK and Bold BI server from the same version. Starting from version 12.1, the AI Assistant settings are restructured. Use the
includeWidgetSummaryandsummaryobjects as shown below.
Example (From 12.1 onwards)
var dashboard = BoldBI.create({
    embedAiAssistant: {
        enabled: true,
        summary: {
            enabled: true,
            includeWidgetSummary: true
        }
    }
});
dashboard.loadDashboard();
hideAiDataUsage
boolean
Specifies whether to show or hide the AI Data Usage icon in the AI Assistant window. Requires the enableaiassistant to be set.
- Default:
false
Example
var dashboard = BoldBI.create({
     embedAiAssistant: {
          enableAiAssistant: true,
          //enabled: true,  //Please use this property from v12.1
          hideAiDataUsage: true
     }
});
dashboard.loadDashboard();
exportSettings
showCSV
boolean
Specifies whether to show or hide the CSV export option.
- Default:
true
Example
var dashboard = BoldBI.create({
     exportSettings: {
          showCSV: true,
     }
});
dashboard.loadDashboard();
showExcel
boolean
Specifies whether to show or hide the Excel export option.
- Default:
true
Example
var dashboard = BoldBI.create({
     exportSettings: {
          showExcel: true,
     }
});
dashboard.loadDashboard();
showImage
boolean
Specifies whether to show or hide the Image export option.
- Default:
true
Example
var dashboard = BoldBI.create({
     exportSettings: {
          showImage: true,
     }
});
dashboard.loadDashboard();
showPDF
boolean
Specifies whether to show or hide the PDF export option.
- Default:
true
Example
var dashboard = BoldBI.create({
     exportSettings: {
          showPDF: true,
     }
});
dashboard.loadDashboard();
languageSettings
hideLanguageDropdown
boolean
Displays or hides the dashboard localization dropdown in the dashboard banner.
- Default:
false - Note: Before setting dashboard localization at the embedding level, configure the
Localize Dashboardoption in the Bold BI Server dashboard designer. The dropdown is visible by default; usehideLanguageDropdownto hide it.
Example
var dashboard = BoldBI.create({
     languageSettings:{
          hideLanguageDropdown: true,
     }
});
dashboard.loadDashboard();
languageCode
string
Contains the value to change the dashboard’s localization during initial rendering.
- Default:
""(empty) - Note: Before setting dashboard localization at the embedding level, configure the
Localize Dashboardoption in the Bold BI Server dashboard designer to enable language changes vialanguageCode.
Example
var dashboard = BoldBI.create({
     languageSettings:{
          languageCode: "fr-FR",
     }
});
dashboard.loadDashboard();
localeSettings
The localeSettings allows you to change the localization of the dashboard, modifying data based on the specified localization.
appLocale
string
Holds the value to change the language of the dashboard, data source, or widget.
- Default:
en-US - Note: Before setting the language at the embedding level, generate the respective language localization file in the Bold BI Server installed location. Refer to here to generate a new locale file.
Example
Note: The
fr-FRlanguage file has been generated in the Bold BI Server installed location.
var dashboard = BoldBI.create({
localeSettings:{
appLocale: "fr-FR",
}
});
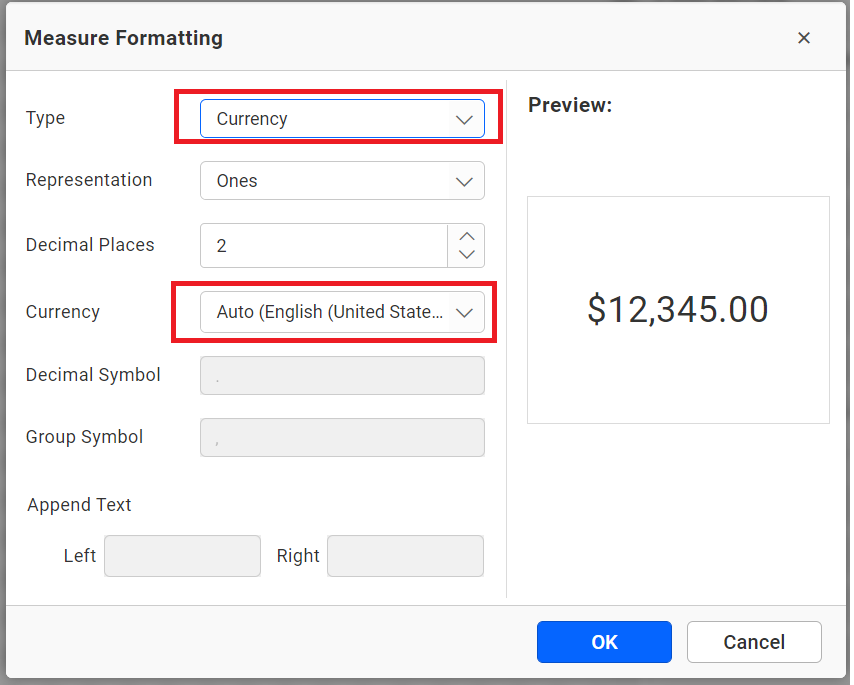
dashboard.loadDashboard();culture
string
Holds the value to change the dashboard’s culture, affecting formats like currency.
- Default:
en-US - Note: You can set the culture for the current user via the API in embedding. For example, configuring a widget to display currency defaults to
Auto (English(en-US)). After setting a custom culture, the widget reflects the new format.
Example
var dashboard = BoldBI.create({
     localeSettings:{
          culture: "en-US",
     }
});
dashboard.loadDashboard();
Additional Info:
- Default currency culture:
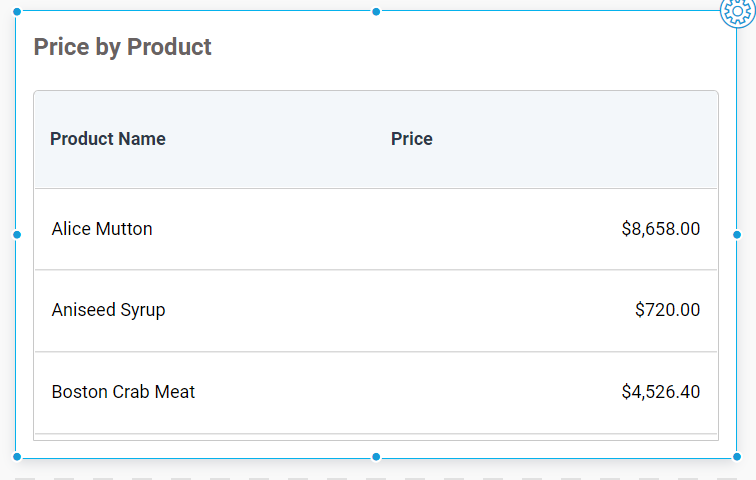
- Default grid view:
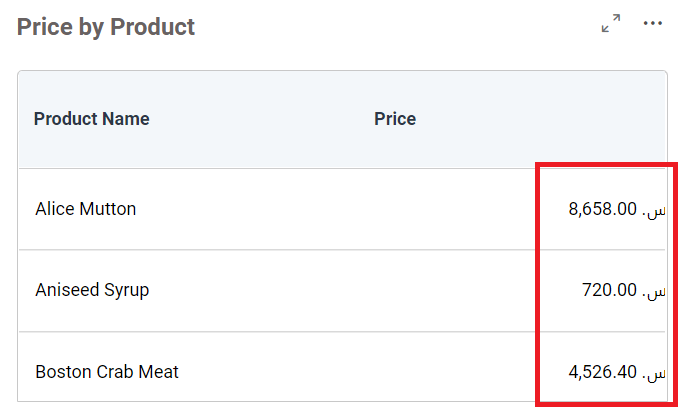
- Modified culture:
- Refer to Embedding In Your Application for setup steps. Use the
cultureSettingsAPI to adjust the culture post-embedding.
widgetContainerSettings
boxShadow
string
Customize the box shadow of the widgets.
- Default:
""(empty)
Example
var dashboard = BoldBI.create({
     widgetContainerSettings: {
          boxShadow: "10px 10px lightblue",
     }
});
dashboard.loadDashboard();
widgetContainerSettings.margin
integer
Customize the margins of the widget with the corresponding integer values.
- Default:
null - Note: Do not specify the
pxsuffix; only integer values are supported.
Example
var dashboard = BoldBI.create({
     widgetContainerSettings: {
          margin: 20,
     }
});
dashboard.loadDashboard();
widgetSettings
widgetSettings.showExport
boolean
Specifies whether to show or hide the Export icon in widget banner.
- Default:
true
Example
var dashboard = BoldBI.create({
     widgetSettings: {
          showExport: true,
     }
});
dashboard.loadDashboard();
showFilter
boolean
Specifies whether to show or hide the Clear Filter icon in widget banner.
- Default:
true
Example
var dashboard = BoldBI.create({
     widgetSettings: {
          showFilter: true,
     }
});
dashboard.loadDashboard();
showMaximize
boolean
Specifies whether to show or hide the Maximize icon in widget banner.
- Default:
true
Example
var dashboard = BoldBI.create({
     widgetSettings: {
          showMaximize: true,
     }
});
dashboard.loadDashboard();
widgetSettings.showMoreOption
boolean
Specifies whether to show or hide the Option icon in widget banner.
- Default:
true
Example
var dashboard = BoldBI.create({
     widgetSettings: {
          showMoreOption: true,
     }
});
dashboard.loadDashboard();- dashboardId
- dashboardPath
- embedContainerId
- embedType
- embedToken
- environment
- expirationTime
- filterParameters
- height
- hideErrorMessage
- isBingMapRequired
- mode
- nonce
- restrictMobileView
- serverUrl
- token
- width
- authorizationServer
- headers
- url
- autoRefreshSettings
- enabled
- autoRefreshSettingshourlySchedule
- hours
- minutes
- seconds
- dashboardSettings
- dashboardName
- enableFilterOverview
- enableFullScreen
- fontFamily
- showDashboardParameter
- showExport
- showHeader
- showMetrics
- showMoreOption
- showRefresh
- dashboardSettingsfilterOverviewSettings
- showSaveAsIcon
- showSaveIcon
- showViewSavedFilterIcon
- dashboardSettingsfilterOverviewSettingsviewId
- dashboardSettingsfilterOverviewSettingsviewName
- dashboardSettingsviewDataSettings
- enableColumnSelection
- enableExporting
- showAllColumns
- designCanvasSettings
- margin
- dynamicConnection
- identity
- isEnabled
- embedAiAssistant
- enableAiAssistant
- name
- enableAiSummary
- enableDashboardSummary
- enableWidgetSummary
- hideAiDataUsage
- exportSettings
- showCSV
- showExcel
- showImage
- showPDF
- languageSettings
- hideLanguageDropdown
- languageCode
- localeSettings
- appLocale
- culture
- widgetContainerSettings
- boxShadow
- widgetContainerSettingsmargin
- widgetSettings
- widgetSettingsshowExport
- showFilter
- showMaximize
- widgetSettingsshowMoreOption
- dashboardId
- dashboardPath
- embedContainerId
- embedType
- embedToken
- environment
- expirationTime
- filterParameters
- height
- hideErrorMessage
- isBingMapRequired
- mode
- nonce
- restrictMobileView
- serverUrl
- token
- width
- authorizationServer
- headers
- url
- autoRefreshSettings
- enabled
- autoRefreshSettingshourlySchedule
- hours
- minutes
- seconds
- dashboardSettings
- dashboardName
- enableFilterOverview
- enableFullScreen
- fontFamily
- showDashboardParameter
- showExport
- showHeader
- showMetrics
- showMoreOption
- showRefresh
- dashboardSettingsfilterOverviewSettings
- showSaveAsIcon
- showSaveIcon
- showViewSavedFilterIcon
- dashboardSettingsfilterOverviewSettingsviewId
- dashboardSettingsfilterOverviewSettingsviewName
- dashboardSettingsviewDataSettings
- enableColumnSelection
- enableExporting
- showAllColumns
- designCanvasSettings
- margin
- dynamicConnection
- identity
- isEnabled
- embedAiAssistant
- enableAiAssistant
- name
- enableAiSummary
- enableDashboardSummary
- enableWidgetSummary
- hideAiDataUsage
- exportSettings
- showCSV
- showExcel
- showImage
- showPDF
- languageSettings
- hideLanguageDropdown
- languageCode
- localeSettings
- appLocale
- culture
- widgetContainerSettings
- boxShadow
- widgetContainerSettingsmargin
- widgetSettings
- widgetSettingsshowExport
- showFilter
- showMaximize
- widgetSettingsshowMoreOption